


- Energy Storage Solutions
- Energy Materials Market
Energy Materials Market Size, Share, and Growth Forecast 2026 - 2033
Energy Materials Market by Material Type (Metals & Alloys, Battery & Electrochemical Materials, Polymers & Composites, Other Materials), Application (Renewable Power Generation, Energy Storage Systems, Transmission & Distribution Infrastructure, Electric Mobility, Hydrogen & Fuel Cell Systems, Other Applications), and Regional Analysis for 2026 - 2033
Energy Materials Market Size and Trend Analysis
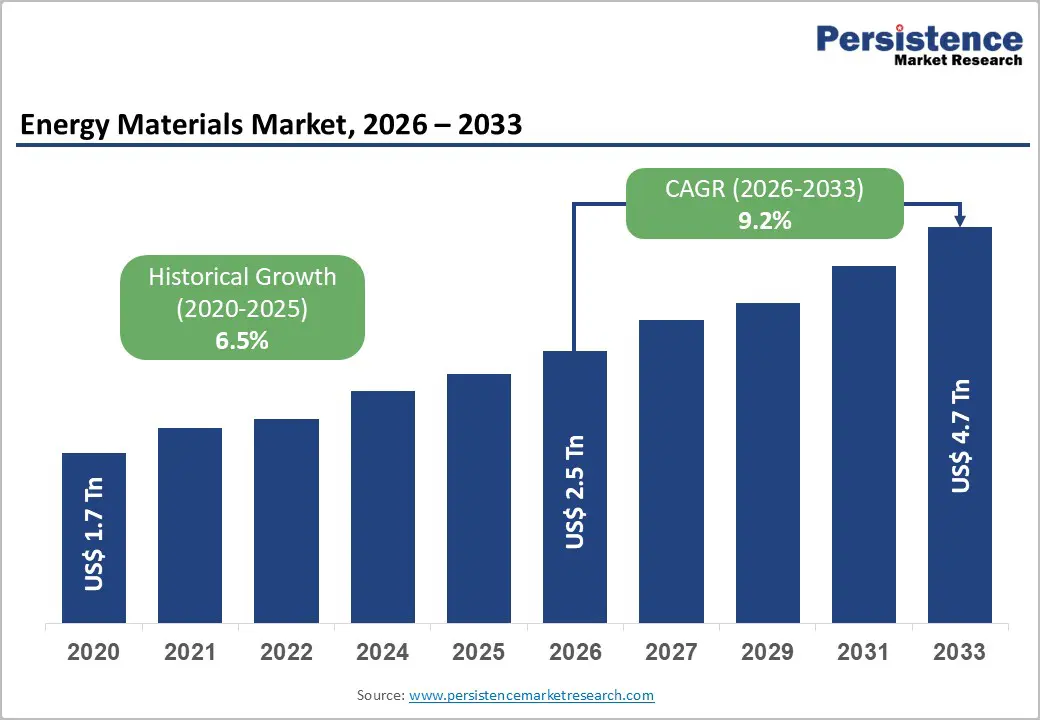
The global energy materials market is valued at approximately US$ 2.5 Tn in 2026 and is projected to reach US$ 4.7 Tn by 2033, growing at a CAGR of 9.2% between 2026 and 2033. This robust expansion is primarily driven by the global acceleration toward clean energy transition and electrification of the transportation sector.
According to the International Energy Agency (IEA), global investment in clean energy reached a record US$ 2.2 trillion in 2025, nearly double that directed at fossil fuels. Rapid growth in renewable capacity installations, utility-scale battery storage deployments, and electrification of mobility is generating exponential demand for advanced metals, battery-grade chemicals, and high-performance composites.
Key Industry Highlights:
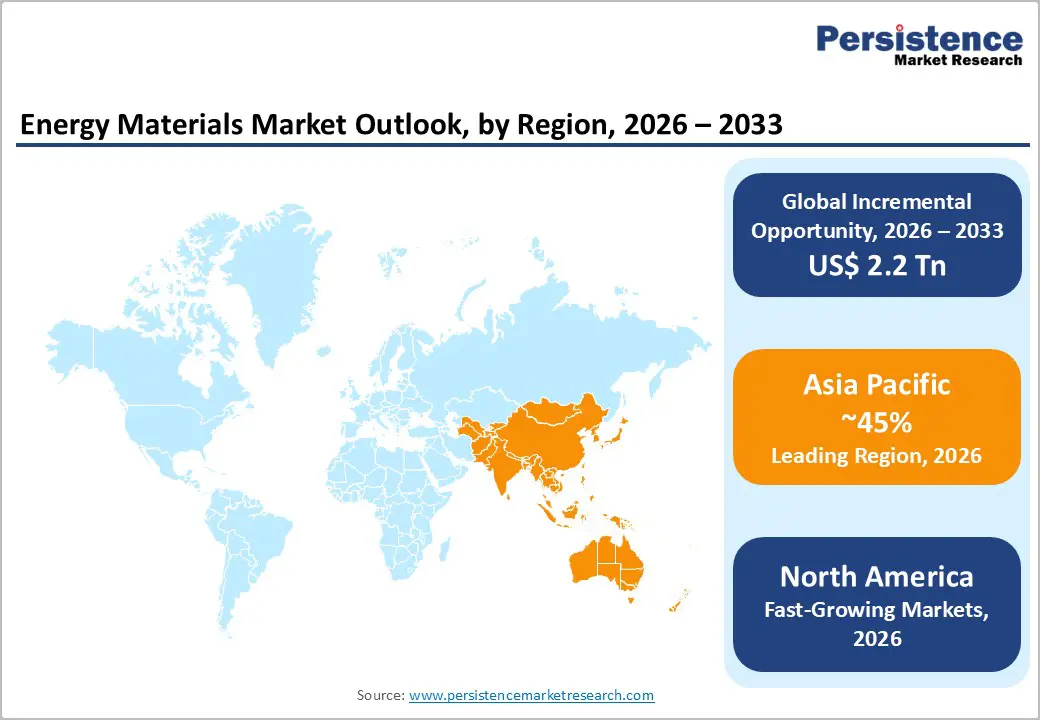
- Leading Region - Asia Pacific leads the global energy materials market with approximately 45% revenue share in 2025, driven by China's dominance in battery manufacturing, material processing, and grid-scale energy storage deployment.
- Fastest-Growing Region - North America represents one of the most dynamic regions for energy materials demand, anchored by the United States' policy-driven industrial buildout. The U.S. Inflation Reduction Act (IRA) has catalyzed over US$ 173 billion in private-sector investment in the clean vehicle and battery supply chain since its enactment, per the U.S.
- Dominant Segment - The Metals & Alloys material type segment holds the largest revenue share (~55%), driven by massive copper, aluminum, and specialty alloy demand for grid modernization, renewable energy infrastructure, and structural energy components.
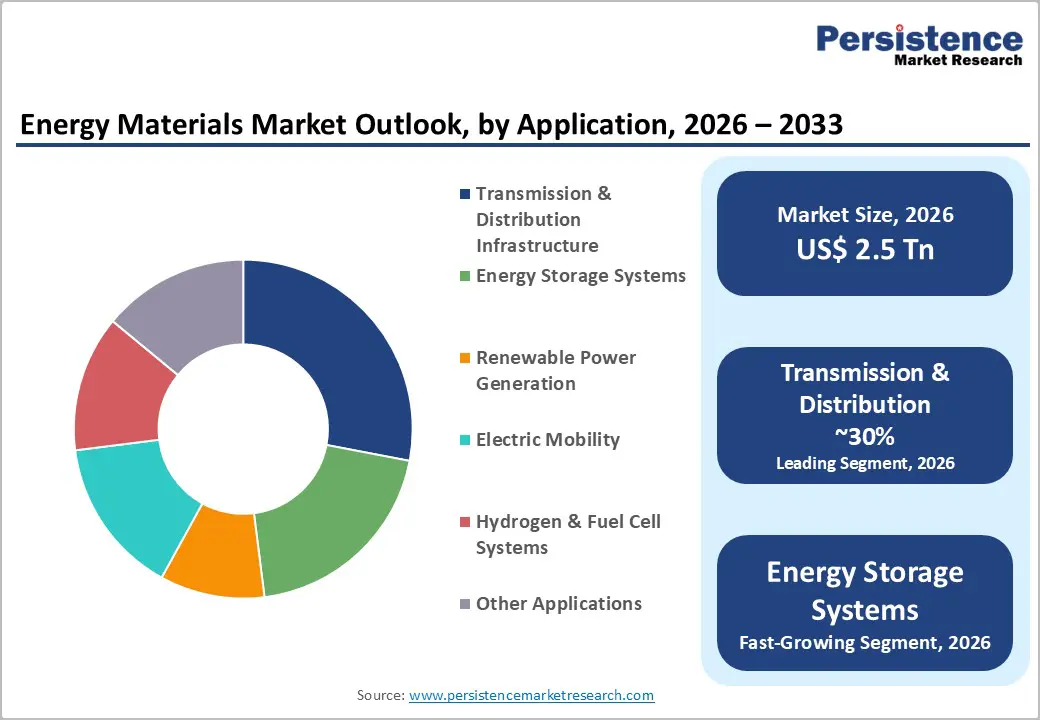
- Fastest-Growing Segment - The Energy Storage Systems application segment is the fastest-growing, expanding at a CAGR of 10.4% through 2033, driven by utility-scale BESS deployments, AI data center storage, and grid balancing for renewable integration.
- Key Opportunity - Closed-loop battery recycling is an emerging high-growth opportunity, with ~500,000 metric tons of end-of-life batteries available by late 2025, mandated recovery thresholds under the EU Battery Regulation, and rising demand for secondary lithium, cobalt, and nickel to supplement constrained primary supply chains.
| Key Insights | Details |
|---|---|
| Energy Materials Market Size (2026E) | US$ 2.5 Trillion |
| Market Value Forecast (2033F) | US$ 4.7 Trillion |
| Projected Growth CAGR (2026 - 2033) | 9.2% |
| Historical Market Growth (2020 - 2025) | 6.5% CAGR |
DRO Analysis
Drivers - Accelerating Global Shift Toward Renewable Energy and Grid Modernization
The most powerful catalyst for demand for energy materials is the unprecedented global pivot toward decarbonized power systems. According to the IEA's World Energy Investment 2024 report, global clean energy investment crossed US$ 3 trillion for the first time in 2024, with renewables and grid infrastructure accounting for the majority. Global electricity demand is forecast to grow by 4.5% in 2025 over 2024 levels, according to the World Resources Institute, driven by electrification, data centre expansion, and industrial growth.
Utilities worldwide are upgrading transmission, distribution, and storage infrastructure, directly expanding demand for copper alloys, high-performance insulation polymers, silicon carbide semiconductors, and advanced composite materials. Grid investments surpassed US$ 400 billion in 2024, with nations such as China, the United States, Germany, and emerging Southeast Asian economies aggressively expanding their high-voltage infrastructure to integrate rising shares of intermittent solar and wind power.
Explosive Growth in Battery-Driven Electric Mobility and Energy Storage
The electrification of transportation and the deployment of grid-scale battery energy storage systems (BESS) are reshaping the demand landscape for electrochemical and battery-grade materials. A total of 17 million electric vehicles (EVs) were sold globally in 2024, with projections indicating 20 million units in 2025, according to industry data. Each 100-kWh battery pack requires approximately 90 kilograms of lithium content alone, underscoring the enormous material intensity of EV adoption.
According to the World Resources Institute, demand for lithium rose by nearly 30% from 2023 to 2024, while demand for nickel, cobalt, and graphite increased by 6-8% in the same period. Critical mineral demand could double by 2030 if governments maintain current energy and climate trajectories.
Restraints - Supply Chain Concentration and Critical Mineral Geopolitical Risk
A primary restraint constraining the energy materials market is the geographic concentration of critical mineral extraction and processing, which exposes global supply chains to systemic risk. According to the U.S. Department of Energy, China controls a dominant share of the processing of lithium, graphite, cobalt, and manganese minerals essential to battery manufacturing.
The U.S. Trade Representative imposed 25% tariffs on certain battery materials originating from China in September 2024. Supply chain disruptions, export controls, or geopolitical tensions involving key producer nations can trigger acute price volatility and project delays. Such concentration amplifies operational risks for energy materials manufacturers dependent on a limited base of refined mineral suppliers.
Lithium Price Volatility and Overcapacity-Driven Market Uncertainty
Volatility in upstream commodity pricing constitutes a significant market restraint for energy materials producers. Following a dramatic surge in lithium carbonate prices in 2022-2023, oversupply from mining expansions in Australia, Chile, and China has since driven prices sharply lower. Albemarle Corporation, a leading lithium producer, reported restructuring activities in 2024 amid price pressures, while guiding 2026 net sales of US$ 5.7-6.0 billion with flat volumes, underscoring margin pressure across the lithium value chain. Such price instability disrupts long-term procurement planning for battery cell manufacturers and cathode suppliers, potentially delaying investment decisions in capacity expansion and R&D, thereby slowing the pace of innovation in next-generation energy materials.
Opportunities - Solid-State Battery Materials and Next-Generation Electrochemical Chemistries
The emergence of solid-state, semi-solid, and sodium-ion battery chemistries represents a transformational opportunity for energy materials companies. Semi-solid-state cells launched in 2024 utilize ultra-thin 150-micrometer lithium metal foils, and next-generation solid-state prototypes eliminate liquid electrolytes entirely, fundamentally expanding demand for advanced ceramic solid electrolytes, lithium metal anodes, and specialized separator materials.
Contemporary Amperex Technology Co., Limited (CATL) launched its Naxtra sodium-ion battery brand in April 2025 and confirmed that it will be ready for large-scale deployment by the end of 2026 across EVs, commercial vehicles, and energy storage. Sodium-ion chemistries use abundant sodium rather than scarce lithium, creating entirely new material supply chains and potentially reducing geopolitical exposure. The anticipated transition to these advanced chemistries will unlock substantial new addressable markets for materials developers and specialty chemical companies during the forecast period.
Battery Recycling and Circular Economy Supply Chains
The scaling of closed-loop battery recycling presents a high-growth opportunity for energy materials companies that can recover battery-grade lithium, cobalt, nickel, and graphite from end-of-life cells. The European Union's Battery Regulation mandates a 90% recovery rate for cobalt and nickel and a 35% recovery rate for lithium by end-2025, creating a compelling demand for recycling-grade material processing technologies.
Umicore SA commenced operations at its battery recycling plant in Poland in August 2024, with the capacity to process 150,000 EV battery packs per year. Approximately 500,000 metric tons of end-of-life batteries will be available for recycling by late 2025, with black mass processing volumes expected to hit 200,000 metric tons in Q4 2025 alone. Companies with proprietary hydrometallurgical and pyrometallurgical recovery platforms stand to capture significant margin by reclaiming high-value materials at lower environmental cost than primary extraction.
Category-wise Analysis
Material Type Insights
The Metals & Alloys segment dominates the global energy materials market, accounting for approximately 55% of total revenue in 2025. This leadership position is underpinned by the indispensable role of copper, aluminum, steel, and specialty alloys in renewable energy infrastructure, power transmission grids, transformer cores, and structural components for wind turbines and solar mounting systems.
Copper is critical to electrification. A single offshore wind turbine can require 8-9 metric tons of copper, and grid modernization globally consumed over 28 million metric tons of copper in 2024 according to the International Copper Association. Escalating grid spending, which surpassed US$ 400 billion globally in 2024 per the IEA, continues to reinforce demand for high-conductivity copper alloys and advanced aluminum composites.
Application Insights
The Transmission & Distribution Infrastructure segment leads across application categories, capturing approximately 26% of energy materials revenue in 2025, supported by accelerating utility-scale grid modernization initiatives across North America, Europe, and the Asia Pacific. Grid investment globally surpassed US$ 400 billion in 2024, with at least 1,650 GW of renewable capacity in advanced development waiting for grid connection worldwide, according to the IEA's Renewables 2024 report.
This infrastructure bottleneck necessitates continuous investment in high-performance conductors, insulating polymers, transformer fluids, and composite cable systems. The Energy Storage Systems application is the fastest-growing segment, expected to expand at a CAGR of 10.4% through 2033, driven by utility-scale BESS deployments, behind-the-meter storage, and AI data center backup power requirements.
Regional Analysis
Asia Pacific Energy Materials Market Trends
Asia Pacific dominates the global energy materials market, accounting for approximately 45% of revenue in 2025, driven primarily by China's commanding position across the entire energy materials value chain. China is the world's leading producer of natural graphite and controls an estimated 85% of global EV battery manufacturing capacity. According to the China Energy Storage Alliance (CNESA), the country's cumulative power storage capacity reached 164.3 GW by June 2025, up 59% year-on-year, with newly commissioned storage projects in the first half of 2025 totalling 23 GW / 56 GWh a 68% jump from the prior year.
India is the fastest-growing country market within Asia Pacific, projected to expand at a CAGR of 11.9% through 2033, supported by record energy investment that reached US$ 150 billion in 2025, including US$ 101 billion for clean energy, per the World Resources Institute. Japan's advanced materials sector, anchored by Panasonic Holdings Corporation and Sumitomo Metal Mining Co., Ltd., continues to be a global benchmark for high-nickel cathode and specialty alloy innovation.
North America Energy Materials Market Trends
North America represents one of the most dynamic regions for energy materials demand, anchored by the United States' policy-driven industrial buildout. The U.S. Inflation Reduction Act (IRA) has catalyzed over US$ 173 billion in private-sector investment in the clean vehicle and battery supply chain since its enactment, per the U.S. Department of the Treasury. Key provisions include the 45X advanced manufacturing production tax credit, which incentivizes domestic battery component and critical mineral processing.
The U.S. Energy Information Administration (EIA) reported domestic battery storage capacity at 28 GW at the end of Q1 2025, with projections to reach 65 GW by 2026, representing significant demand for battery-grade materials. Canada is also emerging as a critical minerals hub, with LG Energy Solution's joint venture NextStar Energy plant expanding to produce energy storage batteries.
Europe Energy Materials Market Trends
Europe's energy materials market is shaped by regulatory ambition and industrial transformation. The EU's Critical Raw Materials Act and Battery Regulation impose stringent sourcing, recycling, and lifecycle disclosure requirements, simultaneously creating compliance burdens and driving long-term demand for responsibly sourced materials. Germany, France, Belgium, and the Nordic countries host major hubs for battery material processing and cathode R&D. BASF SE and Umicore SA are spearheading sustainable cathode-active material production and circular-economy strategies in the region.
The EU's Green Deal Industrial Plan is channeling strategic funding into domestic manufacturing of energy materials to reduce dependence on Chinese supply chains. Umicore's Poland recycling facility, operational since August 2024 with a capacity of 150,000 EV battery packs per year, exemplifies the regional push toward circular supply chains.
Competitive Landscape
The global energy materials market is moderately fragmented, with a mix of large, diversified conglomerates and specialized materials producers competing across distinct product segments. Market leadership is concentrated in Asia, particularly in China, Japan, and South Korea, for battery and electrochemical materials, while North American and European companies lead in specialty metals, polymers, and sustainable materials development. Key differentiators among market leaders include proprietary chemistries, vertical integration from mining to refined output, recycling capabilities, and geographically diversified manufacturing footprints. Emerging business model trends include long-term offtake agreements, strategic joint ventures for domestic supply chain buildout, and closed-loop recycling platforms.
Key Developments:
- In June 2025, CATL announced a USD 6 billion manufacturing complex to scale cathode and nickel processing. Once operational, the site is projected to target 142,000 tons of nickel and 30,000 tons of cathode output annually, plus battery-recycling throughput.
- In April 2025, Amprius launched SiCore 450 Wh/kg lithium-ion batteries that represent a landmark advance in the domain of energy-dense materials. This next-generation cell is built around Amprius's proprietary silicon anode technology to achieve unprecedented energy density and power and is set to impact a multitude of applications.
Companies Covered in Energy Materials Market
- Contemporary Amperex Technology Co., Limited (CATL)
- LG Energy Solution, Ltd.
- Panasonic Holdings Corporation
- Samsung SDI Co., Ltd.
- Albemarle Corporation
- Umicore SA
- Johnson Matthey plc
- Sociedad Química y Minera de Chile S.A. (SQM)
- BASF SE
- Sumitomo Metal Mining Co., Ltd.
Frequently Asked Questions
The global Energy Materials market is estimated to be valued at US$ 2.5 Trillion in 2026 and is projected to reach US$ 4.7 Trillion by 2033, registering a CAGR of 9.2% during the forecast period.
The primary demand drivers include the global acceleration of clean energy investments which surpassed US$ 2.2 trillion in 2025 per the IEA the explosive growth of electric vehicle adoption (with 17 million EVs sold in 2024 and 20 million projected in 2025), and aggressive grid modernization spending that exceeded US$ 400 billion in 2024. Rising demand for lithium (+30% in 2024), nickel, cobalt, and graphite driven by battery adoption further underpins market expansion.
The Metals & Alloys segment is the dominant material type category, holding approximately 55% of global revenue in 2025. Its leadership is driven by high-volume demand for copper and aluminum in transmission grids, transformers, and renewable energy structural systems.
Asia Pacific is the leading region in the global Energy Materials market, accounting for approximately 45% of global revenue in 2025. China's dominance in battery manufacturing with approximately 85% of global EV battery manufacturing capacity combined with the China Energy Storage Alliance (CNESA) reporting 164.3 GW of cumulative storage capacity as of June 2025, cements the region's position.
The leading companies operating in the global Energy Materials market include Contemporary Amperex Technology Co., Limited (CATL), LG Energy Solution, Ltd., Panasonic Holdings Corporation, Samsung SDI Co., Ltd., , and Sumitomo Metal Mining Co., Ltd.


