

- Executive Summary
- Global Climate Resilient Technologies Market Snapshot 2026 and 2033
- Market Opportunity Assessment, 2026 - 2033, US$ Bn
- Key Market Trends
- Industry Developments and Key Market Events
- Demand Side and Supply Side Analysis
- PMR Analysis and Recommendations
- Market Overview
- Market Scope and Definitions
- Value Chain Analysis
- Macro-Economic Factors
- Global GDP Outlook
- Global Prison Growth Outlook
- Global Crime Rates by Country
- Global Prison Population by Country
- Global Private Prison Market Growth Outlook
- Other Macro-economic Factors
- Forecast Factors - Relevance and Impact
- COVID-19 Impact Assessment
- PESTLE Analysis
- Porter's Five Forces Analysis
- Geopolitical Tensions: Market Impact
- Regulatory and Technology Landscape
- Market Dynamics
- Drivers
- Restraints
- Opportunities
- Trends
- Price Trend Analysis, 2020 - 2033
- Region-wise Price Analysis
- Price by Segments
- Price Impact Factors
- Global Climate Resilient Technologies Market Outlook: Historical (2020 - 2025) and Forecast (2026 - 2033)
- Key Highlights
- Global Climate Resilient Technologies Market Outlook: Technology Type
- Introduction/Key Findings
- Historical Market Size (US$ Bn) Analysis by Technology Type, 2020-2025
- Current Market Size (US$ Bn) Forecast, by Technology Type, 2026-2033
- Early Warning Systems (EWS)
- Climate-Resilient Infrastructure
- Water Management Technologies
- Rainwater harvesting
- Smart irrigation
- Desalination & water recycling
- Agricultural Resilience Technologies
- Drought-tolerant seeds
- Precision agriculture
- Climate-smart fertilizers
- Energy Resilience Solutions
- Others
- Market Attractiveness Analysis: Technology Type
- Global Climate Resilient Technologies Market Outlook: Application
- Introduction/Key Findings
- Historical Market Size (US$ Bn) Analysis by Application, 2020-2025
- Current Market Size (US$ Bn) Forecast, by Application, 2026-2033
- Disaster Risk Reduction
- Water & Wastewater Management
- Agriculture & Food Security
- Energy & Power Grid Resilience
- Urban & Infrastructure Resilience
- Coastal Protection & Marine Systems
- Public Health & Emergency Response
- Market Attractiveness Analysis: Application
- Global Climate Resilient Technologies Market Outlook: End-User
- Introduction/Key Findings
- Historical Market Size (US$ Bn) Analysis by End-User, 2020-2025
- Current Market Size (US$ Bn) Forecast, by End-User, 2026-2033
- Government & Public Sector
- Utilities & Energy Companies
- Agriculture & Farming Enterprises
- Construction & Infrastructure Developers
- Water & Wastewater Management Firms
- Telecom & Smart City Integrators
- Insurance & Risk Management Firms
- Market Attractiveness Analysis: End-User
- Global Climate Resilient Technologies Market Outlook: Region
- Key Highlights
- Historical Market Size (US$ Bn) Analysis by Region, 2020-2025
- Current Market Size (US$ Bn) Forecast, by Region, 2026-2033
- North America
- Europe
- East Asia
- South Asia & Oceania
- Latin America
- Middle East & Africa
- Market Attractiveness Analysis: Region
- North America Climate Resilient Technologies Market Outlook: Historical (2020 - 2025) and Forecast (2026 - 2033)
- Key Highlights
- Pricing Analysis
- North America Market Size (US$ Bn) Forecast, by Country, 2026-2033
- U.S.
- Canada
- North America Market Size (US$ Bn) Forecast, by Technology Type, 2026-2033
- Early Warning Systems (EWS)
- Climate-Resilient Infrastructure
- Water Management Technologies
- Rainwater harvesting
- Smart irrigation
- Desalination & water recycling
- Agricultural Resilience Technologies
- Drought-tolerant seeds
- Precision agriculture
- Climate-smart fertilizers
- Energy Resilience Solutions
- Others
- North America Market Size (US$ Bn) Forecast, by Application, 2026-2033
- Disaster Risk Reduction
- Water & Wastewater Management
- Agriculture & Food Security
- Energy & Power Grid Resilience
- Urban & Infrastructure Resilience
- Coastal Protection & Marine Systems
- Public Health & Emergency Response
- North America Market Size (US$ Bn) Forecast, by End-User, 2026-2033
- Government & Public Sector
- Utilities & Energy Companies
- Agriculture & Farming Enterprises
- Construction & Infrastructure Developers
- Water & Wastewater Management Firms
- Telecom & Smart City Integrators
- Insurance & Risk Management Firms
- Europe Climate Resilient Technologies Market Outlook: Historical (2020 - 2025) and Forecast (2026 - 2033)
- Key Highlights
- Pricing Analysis
- Europe Market Size (US$ Bn) Forecast, by Country, 2026-2033
- Germany
- Italy
- France
- U.K.
- Spain
- Russia
- Rest of Europe
- Europe Market Size (US$ Bn) Forecast, by Technology Type, 2026-2033
- Early Warning Systems (EWS)
- Climate-Resilient Infrastructure
- Water Management Technologies
- Rainwater harvesting
- Smart irrigation
- Desalination & water recycling
- Agricultural Resilience Technologies
- Drought-tolerant seeds
- Precision agriculture
- Climate-smart fertilizers
- Energy Resilience Solutions
- Others
- Europe Market Size (US$ Bn) Forecast, by Application, 2026-2033
- Disaster Risk Reduction
- Water & Wastewater Management
- Agriculture & Food Security
- Energy & Power Grid Resilience
- Urban & Infrastructure Resilience
- Coastal Protection & Marine Systems
- Public Health & Emergency Response
- Europe Market Size (US$ Bn) Forecast, by End-User, 2026-2033
- Government & Public Sector
- Utilities & Energy Companies
- Agriculture & Farming Enterprises
- Construction & Infrastructure Developers
- Water & Wastewater Management Firms
- Telecom & Smart City Integrators
- Insurance & Risk Management Firms
- East Asia Climate Resilient Technologies Market Outlook: Historical (2020 - 2025) and Forecast (2026 - 2033)
- Key Highlights
- Pricing Analysis
- East Asia Market Size (US$ Bn) Forecast, by Country, 2026-2033
- China
- Japan
- South Korea
- East Asia Market Size (US$ Bn) Forecast, by Technology Type, 2026-2033
- Early Warning Systems (EWS)
- Climate-Resilient Infrastructure
- Water Management Technologies
- Rainwater harvesting
- Smart irrigation
- Desalination & water recycling
- Agricultural Resilience Technologies
- Drought-tolerant seeds
- Precision agriculture
- Climate-smart fertilizers
- Energy Resilience Solutions
- Others
- East Asia Market Size (US$ Bn) Forecast, by Application, 2026-2033
- Disaster Risk Reduction
- Water & Wastewater Management
- Agriculture & Food Security
- Energy & Power Grid Resilience
- Urban & Infrastructure Resilience
- Coastal Protection & Marine Systems
- Public Health & Emergency Response
- East Asia Market Size (US$ Bn) Forecast, by End-User, 2026-2033
- Government & Public Sector
- Utilities & Energy Companies
- Agriculture & Farming Enterprises
- Construction & Infrastructure Developers
- Water & Wastewater Management Firms
- Telecom & Smart City Integrators
- Insurance & Risk Management Firms
- South Asia & Oceania Climate Resilient Technologies Market Outlook: Historical (2020 - 2025) and Forecast (2026 - 2033)
- Key Highlights
- Pricing Analysis
- South Asia & Oceania Market Size (US$ Bn) Forecast, by Country, 2026-2033
- India
- Southeast Asia
- ANZ
- Rest of SAO
- South Asia & Oceania Market Size (US$ Bn) Forecast, by Technology Type, 2026-2033
- Early Warning Systems (EWS)
- Climate-Resilient Infrastructure
- Water Management Technologies
- Rainwater harvesting
- Smart irrigation
- Desalination & water recycling
- Agricultural Resilience Technologies
- Drought-tolerant seeds
- Precision agriculture
- Climate-smart fertilizers
- Energy Resilience Solutions
- Others
- South Asia & Oceania Market Size (US$ Bn) Forecast, by Application, 2026-2033
- Disaster Risk Reduction
- Water & Wastewater Management
- Agriculture & Food Security
- Energy & Power Grid Resilience
- Urban & Infrastructure Resilience
- Coastal Protection & Marine Systems
- Public Health & Emergency Response
- South Asia & Oceania Market Size (US$ Bn) Forecast, by End-User, 2026-2033
- Government & Public Sector
- Utilities & Energy Companies
- Agriculture & Farming Enterprises
- Construction & Infrastructure Developers
- Water & Wastewater Management Firms
- Telecom & Smart City Integrators
- Insurance & Risk Management Firms
- Latin America Climate Resilient Technologies Market Outlook: Historical (2020 - 2025) and Forecast (2026 - 2033)
- Key Highlights
- Pricing Analysis
- Latin America Market Size (US$ Bn) Forecast, by Country, 2026-2033
- Brazil
- Mexico
- Rest of LATAM
- Latin America Market Size (US$ Bn) Forecast, by Technology Type, 2026-2033
- Early Warning Systems (EWS)
- Climate-Resilient Infrastructure
- Water Management Technologies
- Rainwater harvesting
- Smart irrigation
- Desalination & water recycling
- Agricultural Resilience Technologies
- Drought-tolerant seeds
- Precision agriculture
- Climate-smart fertilizers
- Energy Resilience Solutions
- Others
- Latin America Market Size (US$ Bn) Forecast, by Application, 2026-2033
- Disaster Risk Reduction
- Water & Wastewater Management
- Agriculture & Food Security
- Energy & Power Grid Resilience
- Urban & Infrastructure Resilience
- Coastal Protection & Marine Systems
- Public Health & Emergency Response
- Latin America Market Size (US$ Bn) Forecast, by End-User, 2026-2033
- Government & Public Sector
- Utilities & Energy Companies
- Agriculture & Farming Enterprises
- Construction & Infrastructure Developers
- Water & Wastewater Management Firms
- Telecom & Smart City Integrators
- Insurance & Risk Management Firms
- Middle East & Africa Climate Resilient Technologies Market Outlook: Historical (2020 - 2025) and Forecast (2026 - 2033)
- Key Highlights
- Pricing Analysis
- Middle East & Africa Market Size (US$ Bn) Forecast, by Country, 2026-2033
- GCC Countries
- South Africa
- Northern Africa
- Rest of MEA
- Middle East & Africa Market Size (US$ Bn) Forecast, by Technology Type, 2026-2033
- Early Warning Systems (EWS)
- Climate-Resilient Infrastructure
- Water Management Technologies
- Rainwater harvesting
- Smart irrigation
- Desalination & water recycling
- Agricultural Resilience Technologies
- Drought-tolerant seeds
- Precision agriculture
- Climate-smart fertilizers
- Energy Resilience Solutions
- Others
- Middle East & Africa Market Size (US$ Bn) Forecast, by Application, 2026-2033
- Disaster Risk Reduction
- Water & Wastewater Management
- Agriculture & Food Security
- Energy & Power Grid Resilience
- Urban & Infrastructure Resilience
- Coastal Protection & Marine Systems
- Public Health & Emergency Response
- Middle East & Africa Market Size (US$ Bn) Forecast, by End-User, 2026-2033
- Government & Public Sector
- Utilities & Energy Companies
- Agriculture & Farming Enterprises
- Construction & Infrastructure Developers
- Water & Wastewater Management Firms
- Telecom & Smart City Integrators
- Insurance & Risk Management Firms
- Competition Landscape
- Market Share Analysis, 2025
- Market Structure
- Competition Intensity Mapping
- Competition Dashboard
- Company Profiles
- 3M Company
- Company Overview
- Product Portfolio/Offerings
- Key Financials
- SWOT Analysis
- Company Strategy and Key Developments
- TerraFuse, Inc.
- ClimateAi, inc.
- Climavision
- Challenergy Inc.
- Arup Group Limited
- Kingspan Group
- Saint-Gobain Group
- Gro Intelligence, Inc.
- Xylem Inc.
- Siemens AG
- Schneider Electric SE
- IBM Corporation
- Microsoft Corporation
- BrightFarms Inc.
- The Climate Corporation (Bayer AG)
- Trimble Inc.
- AECOM
- Black & Veatch
- Veolia Environment S.A.
- 3M Company
- Appendix
- Research Methodology
- Research Assumptions
- Acronyms and Abbreviations


- Power Generation, Transmission, & Distribution
- Climate Resilient Technologies Market
Climate Resilient Technologies Market Size, Share, and Growth, Regional Forecasts 2026 - 2033
Climate Resilient Technologies Market by Technology Type (Early Warning Systems, Climate-Resilient Infrastructure, Water Management Technologies, Agricultural Resilience Technologies, Energy Resilience Solutions, Others), Application (Disaster Risk Reduction, Water & Wastewater Management, Agriculture & Food Security, Energy & Power Grid Resilience, Urban & Infrastructure Resilience, Coastal Protection & Marine Systems, Public Health & Emergency Response), End-user, and Regional Analysis, 2026 - 2033
Climate Resilient Technologies Market Size and Trend Analysis
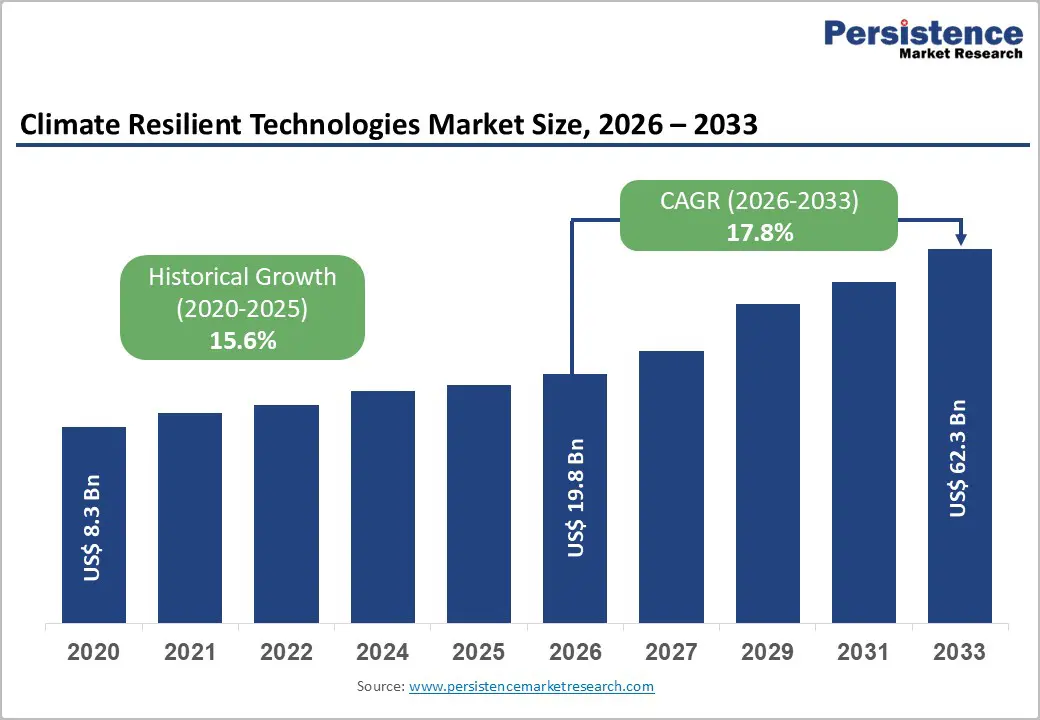
The global climate resilient technologies market size is expected to be valued at US$ 19.8 billion in 2026 and projected to reach US$ 62.3 billion by 2033, growing at a CAGR of 17.8% between 2026 and 2033.
This exceptional expansion is fundamentally driven by accelerating climate change impacts, including extreme weather events, rising sea levels, and prolonged droughts, necessitating adaptive technologies, substantial government investments in climate adaptation infrastructure aligned with international commitments, including the Paris Agreement, and recognition by public and private sectors that are proactive with climate resilience measures.
Key Industry Highlights:
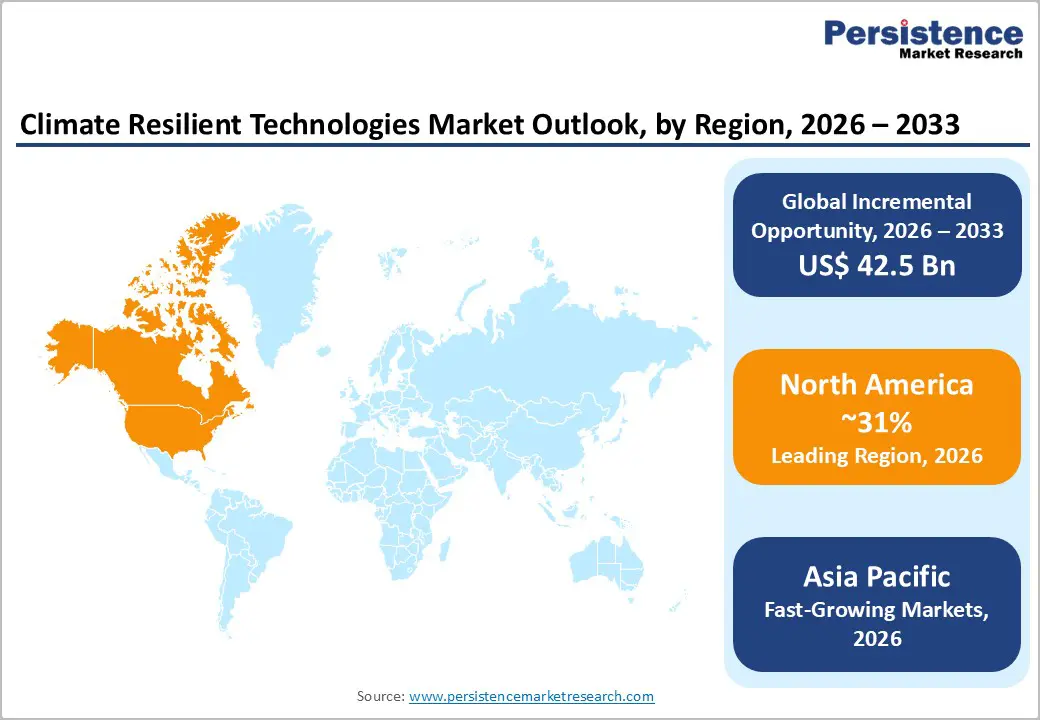
- Leading Region: North America leads the market with about 31% share in 2025, supported by substantial federal climate adaptation funding, advanced monitoring infrastructure, structured resilience programs, and strong private-sector innovation.
- Fastest Growing Region: Asia Pacific is the fastest-growing region, forecast to expand at a 19.4% CAGR during 2026 - 2033, driven by large-scale urban resilience initiatives, smart city programs, high climate vulnerability, and multilateral development financing.
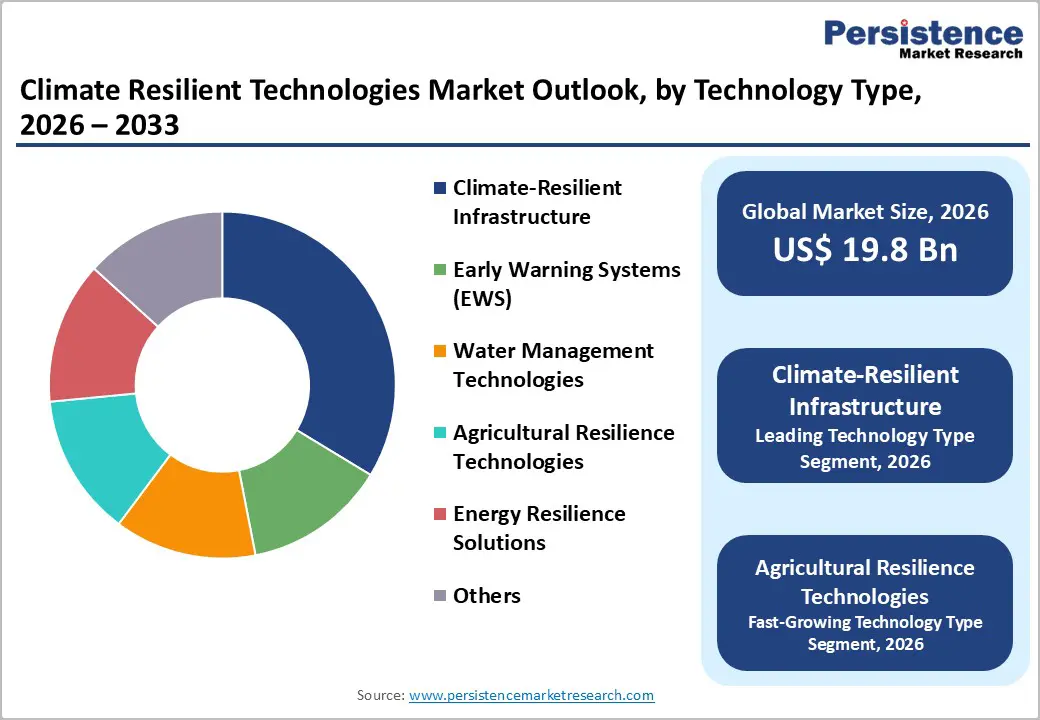
- Dominant Segment: Climate-resilient infrastructure accounts for roughly 29% of the market in 2025, underscoring the critical role of climate-adapted buildings, transport, water, and coastal systems in reducing long-term infrastructure costs.
- Fastest Growing Segment: Agricultural resilience technologies are projected to grow at a 20.3% CAGR through 2033, fueled by rising food demand, increasing climate-related yield risks, and accelerated adoption of climate-smart farming solutions.
- Key market opportunities: Opportunities are anchored in expanding smart city programs, large-scale agricultural adaptation needs, international climate finance flows, and high economic returns from disaster risk reduction investments.
| Key Insights | Details |
|---|---|
| Climate Resilient Technologies Market Size (2026E) | US$ 19.8 billion |
| Market Value Forecast (2033F) | US$ 62.3 billion |
| Projected Growth CAGR (2026 - 2033) | 17.8% |
| Historical Market Growth (2020 - 2025) | 15.6% |
Market Dynamics
Drivers - Rise in Climate Change Impacts and Extreme Weather Event Frequency
The increasing frequency and severity of climate-related disasters represent the primary catalyst driving global investment in climate resilient technologies across all sectors and geographies. The Intergovernmental Panel on Climate Change (IPCC) Sixth Assessment Report documents that global surface temperature has increased by approximately 1.1°C since pre-industrial times, with projections indicating continued warming will intensify extreme weather events including hurricanes, floods, droughts, and heatwaves. The National Oceanic and Atmospheric Administration (NOAA) reports that the United States alone experienced 28 billion-dollar weather and climate disasters in 2023, establishing a new annual record and highlighting the escalating economic toll of climate impacts.
The World Meteorological Organization (WMO) documents that weather, climate, and water-related hazards accounted for 50% of all disasters and 45% of all reported deaths from disasters globally over the past five decades. These devastating impacts are compelling governments to prioritize climate adaptation alongside mitigation strategies, with the United Nations Environment Programme (UNEP) Adaptation Gap Report estimating that developing countries alone will require US$ 160-340 billion annually by 2030 for adaptation measures. Coastal communities facing sea level rise, agricultural regions experiencing shifting rainfall patterns, and urban centers confronting heat island effects are driving demand for early warning systems, resilient infrastructure designs, and water management technologies that enable communities to withstand and recover from climate shocks.
Government Policy Commitments and Climate Adaptation Funding
Unprecedented government commitments to climate action through international agreements and national policies are channeling substantial public funding toward climate resilient technologies and infrastructure. The Paris Agreement under the United Nations Framework Convention on Climate Change (UNFCCC) has mobilized 195 countries to develop and implement National Adaptation Plans addressing climate vulnerabilities and building resilience across sectors. The United States Infrastructure Investment and Jobs Act allocates over US$ 50 billion specifically for climate resilience measures including flood mitigation, drought resilience, coastal restoration, and wildfire prevention.
The European Union's Green Deal and associated funding mechanisms including the Recovery and Resilience Facility dedicate significant resources to climate adaptation, with member states required to allocate at least 37% of recovery plan expenditures to green transition measures. The Green Climate Fund, established under the UNFCCC, has approved over US$ 13 billion in funding for climate projects in developing countries, with significant portions directed toward adaptation technologies and resilient infrastructure. National governments are establishing dedicated climate resilience agencies and programs, such as the U.S. National Climate Resilience Framework and India's National Action Plan on Climate Change, that coordinate investments across water resources, agriculture, coastal zones, and disaster management. These policy frameworks create sustained demand for climate resilient technologies while establishing regulatory requirements and standards that accelerate market adoption.
Restraints - High Initial Capital Investment and Cost-Benefit Assessment Challenges
The substantial upfront costs associated with implementing comprehensive climate resilient technologies create significant adoption barriers, particularly for resource-constrained governments and private sector entities. Advanced early warning systems integrating satellite monitoring, ground-based sensors, predictive analytics, and communication infrastructure can require investments ranging from US$ 10 million to over US$ 100 million depending on geographic coverage and technological sophistication.
Climate-resilient infrastructure incorporating elevated designs, flood barriers, reinforced materials, and redundant systems typically costs 15-30% more than conventional construction according to engineering assessments. The World Bank notes that while climate adaptation investments generally deliver benefit-cost ratios between 2:1 and 10:1, the extended time horizons for realizing benefits and inherent uncertainties in climate projections complicate investment justifications. Small island developing states and least developed countries facing the most severe climate vulnerabilities often lack the financial resources and technical capacity to implement comprehensive resilience measures without substantial international assistance.
Technological Complexity and Integration Challenges
Climate resilient technologies encompass diverse systems including meteorological monitoring equipment, hydraulic infrastructure, agricultural biotechnology, and digital platforms that require sophisticated technical expertise for implementation, operation, and maintenance. The World Meteorological Organization estimates that many developing countries lack adequate hydrometeorological observation networks, with Africa having only one-eighth the minimum recommended density of weather stations.
Integrating early warning systems with emergency response protocols, coordinating resilient infrastructure across multiple jurisdictions, and adapting precision agriculture technologies to local conditions demand specialized knowledge often scarce in regions most vulnerable to climate impacts. The rapid pace of technological advancement creates risks of premature obsolescence, while the lack of standardized protocols and interoperability frameworks complicates system integration across vendors and platforms. Rural and remote communities frequently lack the digital infrastructure and technical workforce necessary to effectively deploy and maintain sophisticated climate resilience technologies.
Opportunities - Agricultural Resilience Technologies and Food Security Solutions
The imperative to ensure global food security amid changing climate conditions presents substantial opportunities for agricultural resilience technologies including drought-tolerant crop varieties, precision agriculture systems, and climate-smart farming practices. The Food and Agriculture Organization (FAO) projects that agricultural production must increase by 70% by 2050 to feed a global population exceeding 9.7 billion people, even as climate change threatens yields in major producing regions. The Consultative Group on International Agricultural Research (CGIAR) reports that climate change could reduce crop yields by 10-25% by 2050 without adaptation measures, creating urgent demand for climate-resilient crop varieties and farming technologies. Precision agriculture technologies utilizing satellite imagery, soil sensors, weather analytics, and automated irrigation systems enable farmers to optimize resource use while adapting to changing conditions.
The U.S. Department of Agriculture (USDA) promotes climate-smart agriculture practices that simultaneously increase productivity, enhance resilience, and reduce greenhouse gas emissions, with federal programs providing financial incentives for technology adoption. Biotechnology companies are developing drought-tolerant, heat-resistant, and pest-resistant crop varieties through both conventional breeding and genetic modification, with drought-tolerant maize varieties already being cultivated on millions of hectares in Africa. The convergence of agricultural technology, data analytics, and climate science creates opportunities for integrated solutions that help farmers adapt to climate variability while improving productivity and sustainability.
Smart City Infrastructure and Urban Climate Resilience
Rapid urbanization combined with escalating climate risks is driving unprecedented investment in smart city technologies that enhance urban resilience through integrated monitoring, predictive analytics, and adaptive infrastructure systems. The United Nations projects that 68% of the global population will live in urban areas by 2050, concentrating climate vulnerabilities in cities where heat islands, flooding, and infrastructure failures can affect millions. The C40 Cities Climate Leadership Group, representing 96 major cities worldwide, has committed member cities to climate action plans incorporating resilient infrastructure, green spaces, and smart technologies. Smart city platforms integrate data from distributed sensors monitoring air quality, water levels, energy consumption, and traffic flows, enabling real-time response to climate events and optimization of urban systems.
The European Innovation Partnership on Smart Cities and Communities coordinates public-private partnerships developing integrated solutions for urban energy, transport, and ICT systems that enhance resilience while reducing emissions. Municipal governments are investing in green infrastructure including permeable pavements, bioswales, urban forests, and green roofs that manage stormwater, reduce heat islands, and improve air quality. The Global Covenant of Mayors for Climate and Energy, representing over 12,000 cities, creates sustained demand for climate resilience technologies as cities implement ambitious adaptation plans. The convergence of Internet of Things, artificial intelligence, and climate modeling enables sophisticated urban resilience platforms that optimize infrastructure performance under changing climate conditions.
Category-wise Analysis
Technology Type Insights
Climate-resilient infrastructure represents the leading technology segment, accounting for around 29% of the market in 2025, due to its central role in safeguarding economic activity and public safety against climate impacts. This segment focuses on designing and upgrading physical assets-such as buildings, transport corridors, energy networks, water systems, and coastal defenses-to withstand long-term climatic stressors rather than historical conditions. Infrastructure standards are increasingly aligned with forward-looking climate projections, improving durability under extreme heat, flooding, storms, and sea-level rise. Investments in resilient infrastructure deliver strong economic value by reducing asset damage, service disruptions, and reconstruction costs over the lifecycle, while ensuring continuity of essential services during extreme climate events.
Application Insights
Disaster risk reduction is the largest application segment, holding approximately 26% market share in 2025, reflecting the growing urgency to mitigate climate-induced human and economic losses. This segment prioritizes technologies that enhance hazard monitoring, early warning, preparedness, and coordinated response to extreme events. Advanced forecasting tools, integrated monitoring systems, and alert dissemination platforms enable authorities to anticipate disasters and implement timely protective actions. As climate change intensifies the frequency and severity of floods, storms, heatwaves, and other hazards, governments and agencies are increasingly investing in predictive and response-oriented solutions. These technologies generate high economic returns by lowering mortality, minimizing infrastructure damage, and reducing post-disaster recovery expenditures.
End-user Insights
The government and public sector segment dominates end-user demand with about 34% market share in 2025, driven by its mandate to protect populations, manage public infrastructure, and ensure national resilience. Public authorities lead climate adaptation planning, finance large-scale resilience projects, and operate critical systems such as meteorological services and emergency management agencies. Investments span flood control, urban drainage, heat mitigation, coastal protection, and disaster preparedness programs. Governments also play a key role in deploying early warning systems and funding community-level resilience initiatives. Through procurement, regulation, and public financing, the public sector establishes market demand, accelerates technology adoption, and sets benchmarks that shape broader climate resilience strategies.
Regional Insights
North America Climate Resilient Technologies Market Trends and Insights
North America demonstrates strong market performance with approximately 31% market share in 2025, driven by substantial government climate adaptation investments, sophisticated technological capabilities, and heightened climate risk awareness following costly disasters. The United States climate resilience market benefits from federal initiatives including the Infrastructure Investment and Jobs Act allocating over US$ 50 billion for climate adaptation measures, the National Climate Task Force coordinating whole-of-government resilience strategies, and FEMA programs supporting community-level adaptation projects. The National Oceanic and Atmospheric Administration (NOAA) operates comprehensive weather monitoring and forecasting systems providing critical data for early warning and climate planning.
The U.S. Army Corps of Engineers implements major coastal protection and flood control infrastructure incorporating climate projections into design standards. California's drought resilience investments including water recycling, desalination, and agricultural efficiency technologies demonstrate state-level climate adaptation leadership. Canada advances climate resilience through its National Adaptation Strategy, investments in northern infrastructure designed for permafrost degradation and extreme cold events, and support for Indigenous community adaptation. The insurance industry increasingly influences resilience investments through risk-based pricing and incentive programs promoting protective measures, with organizations including the Insurance Institute for Business & Home Safety developing fortified construction standards. Technology companies headquartered in North America including Microsoft, IBM, and Schneider Electric leverage artificial intelligence and cloud platforms to deliver sophisticated climate analytics and resilience solutions globally.
Europe Climate Resilient Technologies Market Trends and Insights
Europe exhibits mature market characteristics with comprehensive regulatory frameworks, ambitious climate adaptation targets, and emphasis on nature-based solutions integrated with technological approaches. The European Union's Climate Adaptation Strategy establishes region-wide frameworks for building resilience, with the European Climate Law mandating continuous progress toward adaptation objectives. Germany demonstrates leadership through its German Strategy for Adaptation to Climate Change and substantial investments in flood protection infrastructure along the Rhine and Elbe rivers, resilient urban planning, and agricultural adaptation support programs developed by the Federal Ministry of Food and Agriculture.
The United Kingdom's National Adaptation Programme addresses flood risk management, water resource security, and resilient infrastructure, with Environment Agency programs protecting vulnerable communities and ecosystems. France implements climate adaptation across sectors through its National Plan for Adaptation to Climate Change, with particular emphasis on water management, coastal protection, and agricultural resilience in regions including the Mediterranean coast. The Netherlands provides global leadership in climate resilient infrastructure through its comprehensive Delta Programme managing flood risk and freshwater availability, with innovations including floating architecture, adaptive infrastructure, and sophisticated water management systems. Spain focuses adaptation investments on water scarcity solutions, coastal protection along the Mediterranean, and agricultural technologies supporting olive, citrus, and vineyard production under changing climate conditions. The European Environment Agency coordinates climate vulnerability assessments and adaptation monitoring, while Horizon Europe research funding supports innovation in climate resilience technologies throughout member states.
Asia Pacific Climate Resilient Technologies Market Trends and Insights
Asia Pacific emerges as the fastest-growing regional market with an anticipated CAGR of 19.4% during 2026-2033, propelled by extreme climate vulnerability, rapid urbanization, massive infrastructure development, and growing governmental capacity for climate action. China dominates regional activity through its National Climate Change Adaptation Strategy and massive investments in resilient infrastructure including the Sponge Cities initiative in over 30 cities incorporating green infrastructure for stormwater management, coastal protection infrastructure, and agricultural adaptation technologies supporting food security for 1.4 billion people. The Ministry of Water Resources implements comprehensive flood control and drought management infrastructure.
Japan leverages advanced technology and engineering expertise for climate resilience following devastating natural disasters, with sophisticated early warning systems, earthquake and tsunami-resistant infrastructure, and comprehensive disaster preparedness protocols managed by the Japan Meteorological Agency and Cabinet Office. India demonstrates rapidly expanding climate resilience investments through initiatives including the National Action Plan on Climate Change, smart city programs in 100 cities incorporating climate resilience features, and agricultural adaptation programs supporting 263 million farmers facing changing monsoon patterns and increasing temperatures.
The India Meteorological Department enhances early warning capabilities while the National Disaster Management Authority coordinates resilience building. Southeast Asian nations including Indonesia, Vietnam, Philippines, and Thailand face severe climate vulnerabilities from typhoons, flooding, and sea level rise, driving substantial investments in early warning systems, coastal protection, and resilient infrastructure supported by international development organizations. The Asian Development Bank provides significant financing for climate resilience projects throughout the region, while rapid economic growth enables increasing domestic investment in protective technologies and adaptive infrastructure.
Competitive Landscape
The global climate resilient technologies market displays a moderately fragmented structure, shaped by the convergence of infrastructure development, digital technologies, and environmental solutions. The competitive landscape includes large, diversified solution providers alongside niche specialists focused on specific climate risks or applications. Market competition is driven less by price and more by technological depth, system integration capability, and the ability to deliver scalable, long-term resilience outcomes.
Leading participants emphasize integrated platforms that combine physical infrastructure solutions with digital monitoring, analytics, and decision-support tools. Business strategies increasingly center on partnerships with public authorities, development agencies, and research institutions to secure large-scale projects and long-term contracts. Geographic expansion into climate-vulnerable and emerging economies remains a key growth approach, supported by localized offerings and regulatory alignment. Continuous investment in research and development underpins innovation, while venture funding accelerates the entry of specialized players addressing targeted resilience needs.
Key Developments:
- September 2024 - BASF partnered with Takazuri to support climate-resilient construction in Eastern Africa by combining smart sustainable building solutions with tailored BASF additive packages for enhanced weather durability.
- July 2025 - Solex Energy unveiled two advanced high-performance solar products designed for extreme climate conditions, expanding its regional solar technology offerings and supporting growing renewable energy demand.
- January 2026 - Nutrifresh Farm Tech India signed a Rs. 2,500 crore Memorandum of Understanding with the Government of Maharashtra at the World Economic Forum in Davos to advance climate-smart, technology-driven agriculture in the state.
Companies Covered in Climate Resilient Technologies Market
- 3M Company
- TerraFuse, Inc.
- ClimateAi, inc.
- Climavision
- Challenergy Inc.
- Arup Group Limited
- Kingspan Group
- Saint-Gobain Group
- Gro Intelligence, Inc.
- Xylem Inc.
- Siemens AG
- Schneider Electric SE
- IBM Corporation
- Microsoft Corporation
- BrightFarms Inc.
- The Climate Corporation (Bayer AG)
- Trimble Inc.
- AECOM
- Black & Veatch
- Veolia Environment S.A.
Frequently Asked Questions
The climate resilient technologies market is projected to reach approximately US$ 19.8 billion in 2026.
Demand is driven by rising extreme weather events, strong government climate policies, increasing adaptation funding needs, and high economic returns from resilience investments.
North America leads the market with around 31% share due to strong federal funding, advanced monitoring systems, and high climate risk awareness.
Key opportunities lie in agricultural adaptation, smart city programs, international climate finance, and high-return disaster risk reduction initiatives.
Leading providers include Siemens AG, Schneider Electric SE, IBM Corporation, Microsoft Corporation, Xylem Inc., AECOM, Arup Group Limited, Saint-Gobain Group, Kingspan Group, etc.


