
Loading page data
Please wait a moment
Loading page data
Please wait a moment


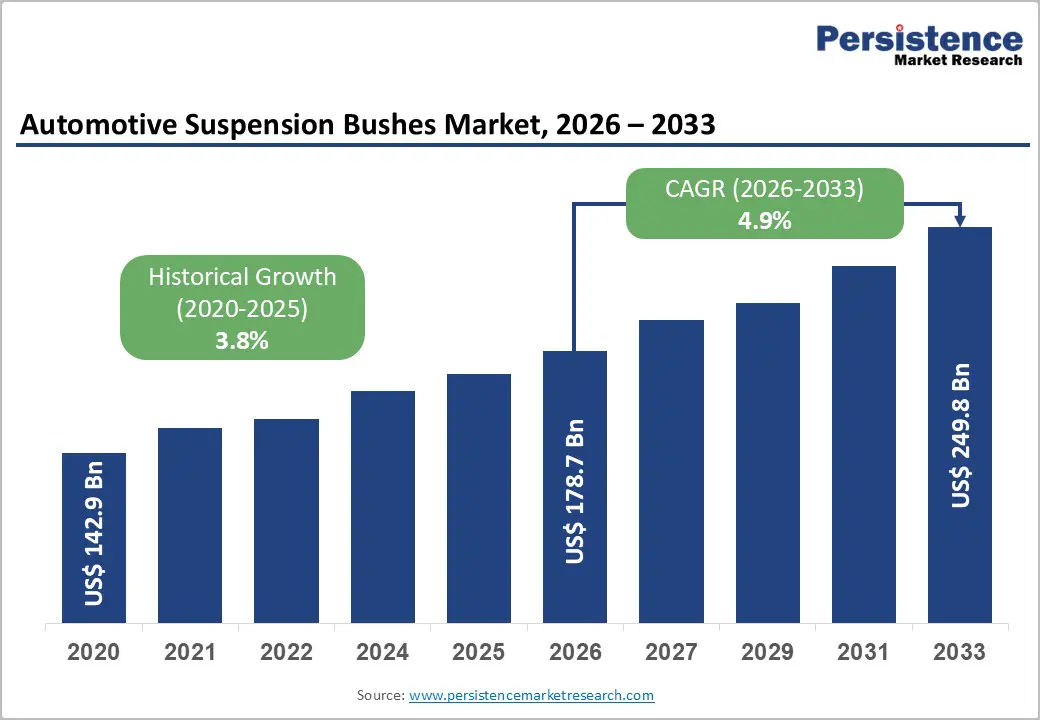
The global automotive suspension bushes market was valued at US$ 178.7 billion in 2026 and is projected to reach US$ 249.8 billion by 2033, growing at a CAGR of 4.9% between 2026 and 2033.
The market's robust expansion is driven by increasing demand for advanced suspension systems that enhance ride comfort, handling precision, and overall vehicle performance. As consumers prioritize driving experience quality and automakers emphasize noise, vibration, and harshness (NVH) reduction, suspension bushes have become critical components in modern vehicle architecture.
| Global Market Attributes | Key Insights |
|---|---|
| Automotive Suspension Bushes Market Size (2026E) | US$ 178.7 Bn |
| Market Value Forecast (2033F) | US$ 249.8 Bn |
| Projected Growth (CAGR 2026 to 2033) | 4.9% |
| Historical Market Growth (CAGR 2020 to 2024) | 3.8% |
Rising Electrification and Advanced Suspension System Integration
The global shift toward electric and hybrid vehicles is fundamentally transforming suspension bushing requirements and creating unprecedented market opportunities. Electric vehicles introduce unique engineering challenges, including increased vehicle weight from battery systems, higher torque delivery, and the need for superior noise isolation compared to internal combustion engine vehicles. Modern electric platforms demand bushings capable of managing heavier battery packs distributed across the vehicle floor, which significantly increases mechanical stress on suspension components.
Vibracoustic, a leading global automotive NVH specialist, recently engineered air spring systems, jounce bumpers, and hydro bushings specifically designed for premium electric pickup trucks to manage the additional weight and performance requirements. The integration of lightweight materials, such as polyurethane and advanced elastomers, enables manufacturers to meet demanding weight-reduction targets to improve electric vehicle range while maintaining superior ride quality and structural integrity.
Growing Global Automotive Production and OEM Demand
Global vehicle production volumes continue to expand, particularly in emerging markets and regions prioritizing electrification and advanced manufacturing. The Asia-Pacific region, accounting for 50.74 million units in 2024 and a 2.8% CAGR from 2020 to 2024, remains the primary demand driver for automotive suspension components. China produced 31.28 million vehicles in 2024, including more than 10 million new-energy models, reinforcing its position as the primary driver of demand for precision suspension components. India’s automotive production continues to accelerate through government incentive programs such as the Production-Linked Incentive (PLI) scheme, which has attracted over USD 6 billion in foreign investment commitments for automotive component manufacturing. North America's recovery and capacity expansion, supported by localization requirements under the USMCA, are driving sustained demand for OEM suspension bushings.
Raw Material Price Volatility and Supply Chain Disruptions
Automotive suspension bushings face significant headwinds from persistent volatility in raw material pricing and ongoing supply chain fragmentation. Bushings are predominantly manufactured from natural rubber, polyurethane, or synthetic rubber, materials heavily dependent on commodity markets and vulnerable to geopolitical disruptions. Thailand, which accounts for 35% of global natural rubber output, experienced prolonged monsoon rains in 2022-2023, substantially reducing latex yields and constraining global supply. Indonesia, facing regulatory pressures on plantation expansion due to deforestation policies, has limited its ability to expand natural rubber production capacity.
Synthetic rubber, derived from petroleum products, remains susceptible to crude oil price fluctuations influenced by Russia-Ukraine geopolitical tensions and OPEC+ production management decisions. This dual dependence on natural and synthetic rubber sources leaves manufacturers with severely limited flexibility in their sourcing strategies, as substitution options are economically prohibitive and logistically complex.
Technological Obsolescence and Rapid Vehicle Design Evolution
The automotive industry's accelerating innovation cycle poses a significant challenge for suspension bushing manufacturers due to rapid technological obsolescence. Vehicle designs, engineering specifications, and suspension architectures evolve continuously, potentially rendering existing bushing designs incompatible with next-generation vehicle platforms. The transition from traditional suspension geometries to advanced multi-link systems, semi-active damping architectures, and fully active suspension technology requires complete redesigns of bushing specifications and manufacturing processes.
Manufacturers failing to anticipate and adapt to these technological shifts face production inefficiencies, inventory obsolescence, and loss of OEM contracts. The capital-intensive nature of tooling and manufacturing equipment amplifies the financial risk of design obsolescence, particularly for mid-sized suppliers that lack research and development resources comparable to those of tier-one component manufacturers.
Smart Bushings and Predictive Maintenance Integration in Commercial Fleet Operations
The emergence of sensor-embedded "smart bushings" represents a transformative market opportunity, particularly for commercial fleet operators and logistics companies seeking to optimize operational efficiency and reduce unplanned downtime. Smart bushings incorporate embedded accelerometers and strain gauges that monitor vibration frequency, temperature, load stress, and road surface conditions in real time, transmitting diagnostic data to vehicle control systems to optimize dynamic suspension performance. Continental AG's Vibracoustic division launched Active Bush technology featuring embedded sensors that detect road imperfections and enable predictive maintenance alerts. This technology reportedly reduces unplanned downtime by up to 30% in commercial fleet operations, addressing a critical pain point for ride-hailing services, logistics operators, and long-haul commercial fleets.
Electric Vehicle Weight Management and Specialized Polyurethane Material Applications
The surge in global electric vehicle production is creating specialized demand for premium suspension bushings engineered to manage substantially higher vehicle weight while maintaining superior ride quality and NVH performance. Electric vehicles typically exceed conventional vehicles' weight by 400-600 kilograms due to battery systems, necessitating bushings with enhanced load-bearing capacity and superior vibration isolation. Polyurethane bushings, which offer superior durability, chemical resistance, and performance under sustained loading compared to traditional rubber compounds, are positioned to capture significant market share in the electric vehicle segment. Vibracoustic hydro bushings, featuring fluid-filled damping systems with integrated radial plastic stoppers, exemplify this specialization and are designed for heavy electric vehicles that require optimal vibration damping without compromising component lifespan.
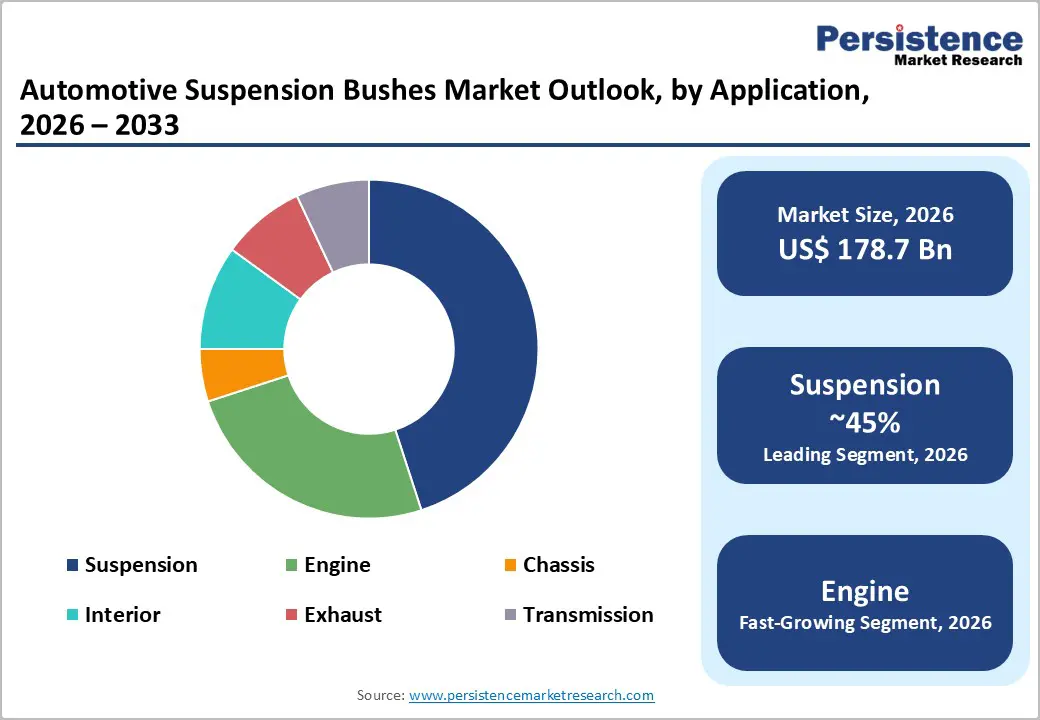
The Suspension segment holds the dominant market position with approximately 45% market share, reflecting its critical role in vehicle safety, comfort, and performance. Suspension bushings directly address the fundamental engineering challenge of isolating the vehicle chassis from road vibrations and impacts, making them essential components in all vehicle architectures. Their primary functions encompass vibration absorption, noise reduction, and maintenance of correct suspension geometry to prevent corrosion at metal connection points. The segment's sustained market leadership is reinforced by increasing consumer expectations for ride quality and the proliferation of advanced suspension systems in mass-market vehicles.
Modern vehicles increasingly incorporate multi-link suspensions, air suspension systems, and semi-active damping technologies, each of which requires specialized bushing designs. The demand remains particularly strong for SUVs and crossovers, which are among the fastest-growing vehicle segments globally and require more robust bushings to accommodate increased weight and load-bearing requirements.
Passenger Cars command the largest market share at approximately 58%, driven by global passenger vehicle sales volume and the increasing integration of bushings for NVH reduction across mainstream vehicle segments. Hatchbacks and sedans, representing the highest-volume vehicle segments globally, prioritize comfort, fuel efficiency, and affordability, necessitating high-quality bushings to minimize the transmission of noise, vibration, and harshness to vehicle occupants. Advanced bushing materials, including polyurethane and engineered composites, have become increasingly common in mass-market passenger vehicles as manufacturers seek to deliver premium ride quality as a competitive differentiator.
The use of bushings in engine mounts, control arms, and subframe connections has increased significantly, with modern passenger vehicles incorporating 8-12 bushings, compared with 5-6 in vehicles designed two decades ago. Light Commercial Vehicles represent the fastest-growing vehicle category, expanding at approximately 5.2% CAGR through 2035, driven by accelerating e-commerce logistics expansion, last-mile delivery growth, and fleet operator investments in electrified commercial vehicles.
Rubber remains the dominant material, accounting for approximately 61% of the global suspension bushes market share due to its exceptional vibration-damping properties, cost-effectiveness, and established manufacturing infrastructure. Natural and synthetic rubber compounds provide superior vibration isolation relative to harder materials, making them the preferred choice for general-purpose suspension applications across mass-market vehicle segments. The affordability and simplicity of rubber bushing production enable manufacturers to maintain competitive pricing while achieving performance standards acceptable for conventional vehicle platforms.
Advanced rubber formulations incorporating specialized additives have significantly improved material performance, enhancing heat resistance, chemical durability, and service life extension. Polyurethane bushings are experiencing accelerated adoption at an approximately 5.8% CAGR, driven by superior durability, resistance to oil and chemical degradation, and enhanced performance under sustained mechanical loading. Polyurethane's superior performance characteristics make it the preferred material for performance-oriented applications, heavy-duty commercial vehicles, and electric vehicle platforms where enhanced load capacity and extended service life justify the premium material cost.
North America, particularly the United States, represents a significant market driven by robust automotive manufacturing capacity, stringent vehicle safety and emissions regulations, and strong aftermarket demand from aging vehicle fleets. The U.S. automotive manufacturing recovery has stimulated demand for advanced suspension components, with total U.S. motor vehicle and parts production increasing by 2.6% in 2026, supported by continued investment in electric-vehicle assembly facilities and SUV production expansion. USMCA regional value content requirements have incentivized manufacturers to localize suspension component production, with14% increases in domestic sourcing contracts for forged and cast aluminum suspension components reported by the U.S. Department of Commerce in March 2024.
The U.S. represents approximately 65% of the regional market value, supported by established tier-one supplier networks, advanced manufacturing infrastructure, and robust regulatory frameworks, including Euro and SAE suspension performance standards. Canada’s automotive sector continues to expand, particularly in electric-vehicle and premium-vehicle production, thereby generating regional demand growth. Mexico's status as a primary manufacturing and export hub for North American OEMs has solidified its position in regional supply chains, with nearshoring investments exceeding USD 9.5 billion in the automotive parts sector in 2024, supporting continued production of suspension components for regional and global markets.
Europe is a mature yet resilient market characterized by stringent emissions regulations, advanced manufacturing capabilities, and substantial investment in electric-vehicle platform development. European vehicle production declined 6.2% to 11.4 million units in 2024, with Germany experiencing a6.9% production contraction despite maintaining the region's largest automotive manufacturing base at approximately 4.07 million units annually. Germany, Spain, and France collectively account for approximately 60% of European automotive production, and these countries host advanced manufacturing facilities that specialize in electric-vehicle components and premium suspension systems. The implementation of Euro 7 emission standards, effective 2026, introduces stringent non-exhaust emission regulations, including particulate matter from tire and brake wear, creating demand for advanced suspension bushings engineered to minimize vibration transmission and reduce noise pollution.
Battery production capacity expansion across Central Europe, with planned gigafactory investments exceeding EUR 4.5 billion in Poland and Hungary, will drive sustained demand for specialized electric vehicle suspension components. Europe’s regulatory emphasis on environmental sustainability and circular economy principles is fostering the development of bio-based elastomers and recyclable bushing materials, positioning manufacturers adopting sustainable production practices as market leaders.
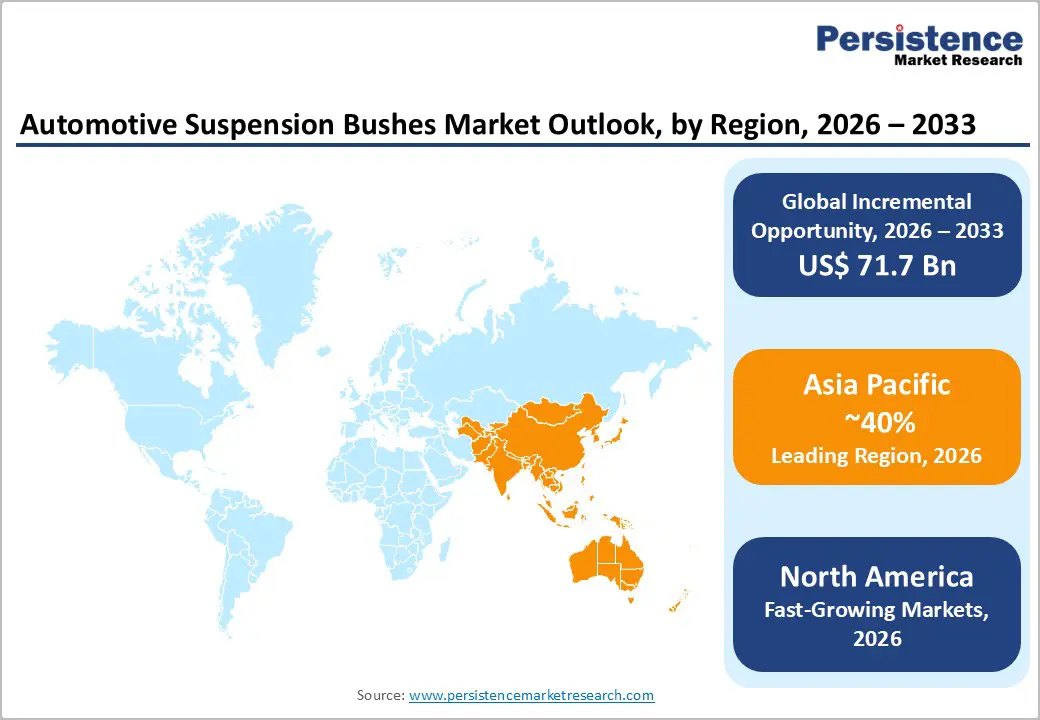
The Asia-Pacific region dominates the global automotive suspension bushes market, commanding approximately 40% of the market, driven by high vehicle production volumes and rapidly expanding automotive manufacturing capacity in China, India, and Southeast Asia. China's production of 31.28 million vehicles in 2024, including 10 million new-energy vehicles, accounts for approximately 40% of global vehicle production, positioning the region as the primary driver of demand for suspension components. Chinese government policies that support domestic electric-vehicle adoption and infrastructure development are accelerating demand for advanced suspension bushings engineered specifically for electric-vehicle platforms.
India's automotive production continues to accelerate through government support programs, including the Automotive Mission Plan 2047, which targets sustainable and inclusive growth in indigenous automotive component manufacturing.
Japan's automotive industry maintains technological leadership through continuous research and development investments in advanced materials, sensor integration, and predictive maintenance technologies for suspension systems. Toyota’s upcoming smart-factory initiatives, expected to debut in the early 2030s, will drive regional adoption of AI-enabled manufacturing processes, improving precision and quality in suspension bushing production.
The Automotive Suspension Bushes market exhibits moderate consolidation, with tier-one automotive suppliers dominating through extensive manufacturing networks, advanced research and development capabilities, and established relationships with global original equipment manufacturers. Continental AG and Vibracoustic lead the market through comprehensive product portfolios spanning suspension, engine, transmission, and chassis applications, combined with sophisticated sensor integration capabilities enabling "smart bushing" development.
Schaeffler AG, expanded through its merger with Vitesco Technologies, has enhanced its position by integrating diverse powertrain and chassis electrification expertise, enabling development of advanced suspension solutions for electrified vehicle platforms. Mid-sized regional suppliers including Teknorot, Kesaria Rubber Industries, and MEYLE AG maintain competitive positions through specialization in specific vehicle segments, geographic markets, or advanced material development.
The global Automotive Suspension Bushes market was valued at US$ 178.7 billion in 2026 and is projected to reach US$ 249.8 billion by 2033, expanding at a 4.9% CAGR.
Key market drivers include rising electric vehicle adoption requiring specialized bushings for battery weight management, increasing consumer demand for superior NVH performance, and growing vehicle production in Asia-Pacific with 31.28 million vehicles produced in China in 2024.
The Suspension application segment dominates with approximately 45% market share, driven by its critical role in vibration absorption, noise reduction, and vehicle handling optimization.
Asia-Pacific dominates with approximately 40% global market share, driven by extraordinary vehicle production volumes, rapid electrification adoption, and substantial government support for automotive manufacturing.
Continental AG through its Vibracoustic division, Schaeffler AG, and Conti Tech Deutschland GmbH dominate the market through comprehensive product portfolios and advanced research capabilities.


