


- Executive Summary
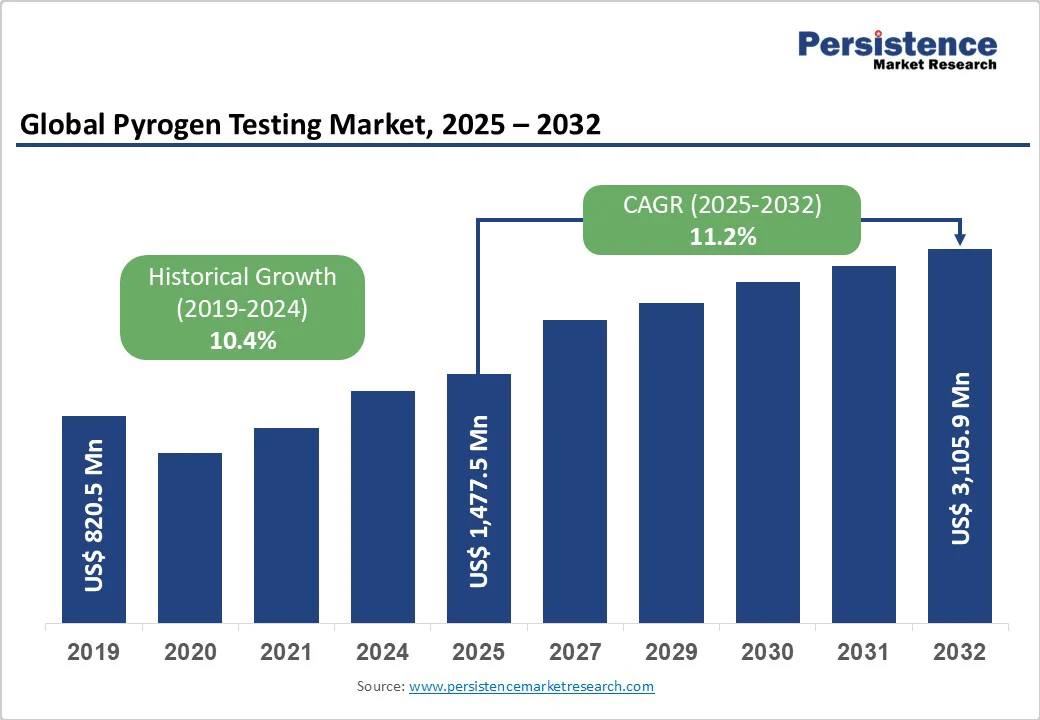
- Global Pyrogen Testing Market Snapshot, 2025 and 2032
- Market Opportunity Assessment, 2025 - 2032, US$ Mn
- Key Market Trends
- Future Market Projections
- Premium Market Insights
- Industry Developments and Key Market Events
- PMR Analysis and Recommendations
- Market Overview
- Market Scope and Definition
- Market Dynamics
- Drivers
- Restraints
- Opportunity
- Key Trends
- Macro-Economic Factors
- Global Sectorial Outlook
- Global GDP Growth Outlook
- COVID-19 Impact Analysis
- Forecast Factors - Relevance and Impact
- Value Added Insights
- Product & Service Adoption Analysis
- Regulatory Landscape
- Value Chain Analysis
- Key Deals and Mergers
- PESTLE Analysis
- Porter’s Five Force Analysis
- Global Pyrogen Testing Market Outlook:
- Key Highlights
- Market Size (US$ Mn) and Y-o-Y Growth
- Absolute $ Opportunity
- Market Size (US$ Mn) Analysis and Forecast
- Historical Market Size (US$ Mn) Analysis, 2019-2024
- Market Size (US$ Mn) Analysis and Forecast, 2025-2032
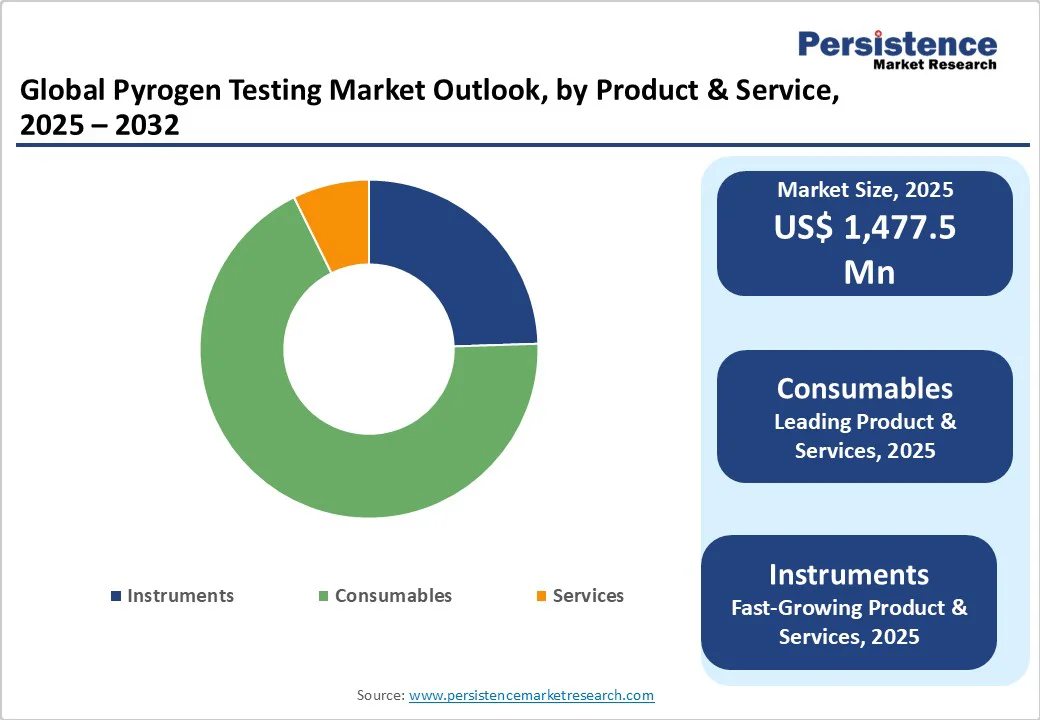
- Global Pyrogen Testing Market Outlook: Product & Service
- Introduction / Key Findings
- Historical Market Size (US$ Mn) Analysis, By Product & Service, 2019 - 2024
- Market Size (US$ Mn) Analysis and Forecast, By Product & Service, 2025 - 2032
- Instruments
- Consumables
- Services
- Market Attractiveness Analysis: By Product & Service
- Global Pyrogen Testing Market Outlook: Test
- Introduction / Key Findings
- Historical Market Size (US$ Mn) Analysis, By Test, 2019 - 2024
- Market Size (US$ Mn) Analysis and Forecast, By Test, 2025 - 2032
- In-vitro-based Pyrogen Tests
- Rabbit Pyrogen Tests
- Limulus Amebocyte Lysate Tests
- Others
- Market Attractiveness Analysis: Test
- Global Pyrogen Testing Market Outlook: End User
- Introduction / Key Findings
- Historical Market Size (US$ Mn) Analysis, By End User, 2019 - 2024
- Market Size (US$ Mn) Analysis and Forecast, By End User, 2025 - 2032
- Pharmaceutical Companies
- Biotechnology Companies
- Medical Device Companies
- Diagnostic Laboratories
- Others
- Market Attractiveness Analysis: End User
- Key Highlights
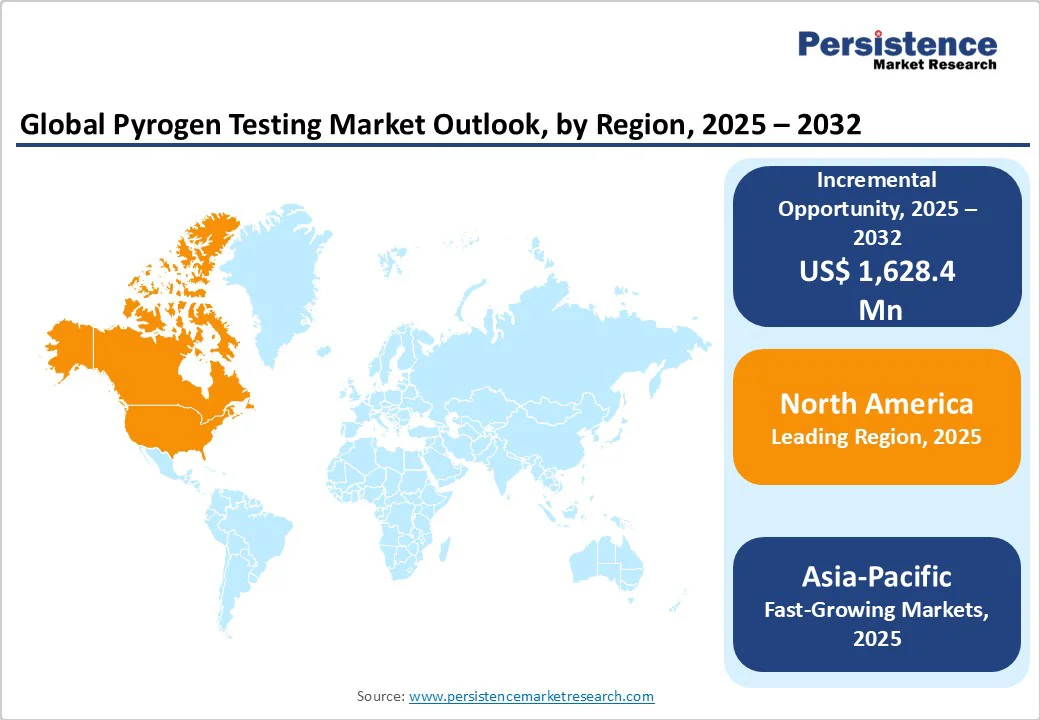
- Global Pyrogen Testing Market Outlook: Region
- Key Highlights
- Historical Market Size (US$ Mn) Analysis, By Region, 2019 - 2024
- Market Size (US$ Mn) Analysis and Forecast, By Region, 2025 - 2032
- North America
- Europe
- East Asia
- South Asia and Oceania
- Latin America
- Middle East & Africa
- Market Attractiveness Analysis: Region
- North America Pyrogen Testing Market Outlook:
- Key Highlights
- Historical Market Size (US$ Mn) Analysis, By Market, 2019 - 2024
- By Country
- By Product & Service
- By Test
- By End User
- Market Size (US$ Mn) Analysis and Forecast, By Country, 2025 - 2032
- U.S.
- Canada
- Market Size (US$ Mn) Analysis and Forecast, By Product & Service, 2025 - 2032
- Instruments
- Consumables
- Services
- Market Size (US$ Mn) Analysis and Forecast, By Test, 2025 - 2032
- In-vitro-based Pyrogen Tests
- Rabbit Pyrogen Tests
- Limulus Amebocyte Lysate Tests
- Others
- Market Size (US$ Mn) Analysis and Forecast, By End User, 2025 - 2032
- Pharmaceutical Companies
- Biotechnology Companies
- Medical Device Companies
- Diagnostic Laboratories
- Others
- Market Attractiveness Analysis
- Europe Pyrogen Testing Market Outlook:
- Key Highlights
- Historical Market Size (US$ Mn) Analysis, By Market, 2019 - 2024
- By Country
- By Product & Service
- By Test
- By End User
- Market Size (US$ Mn) Analysis and Forecast, By Country, 2025 - 2032
- Germany
- France
- U.K.
- Italy
- Spain
- Russia
- Türkiye
- Rest of Europe
- Market Size (US$ Mn) Analysis and Forecast, By Product & Service, 2025 - 2032
- Instruments
- Consumables
- Services
- Market Size (US$ Mn) Analysis and Forecast, By Test, 2025 - 2032
- In-vitro-based Pyrogen Tests
- Rabbit Pyrogen Tests
- Limulus Amebocyte Lysate Tests
- Others
- Market Size (US$ Mn) Analysis and Forecast, By End User, 2025 - 2032
- Pharmaceutical Companies
- Biotechnology Companies
- Medical Device Companies
- Diagnostic Laboratories
- Others
- Market Attractiveness Analysis
- East Asia Pyrogen Testing Market Outlook:
- Key Highlights
- Historical Market Size (US$ Mn) Analysis, By Market, 2019 - 2024
- By Country
- By Product & Service
- By Test
- By End User
- Market Size (US$ Mn) Analysis and Forecast, By Country, 2025 - 2032
- China
- Japan
- South Korea
- Market Size (US$ Mn) Analysis and Forecast, By Product & Service, 2025 - 2032
- Instruments
- Consumables
- Services
- Market Size (US$ Mn) Analysis and Forecast, By Test, 2025 - 2032
- In-vitro-based Pyrogen Tests
- Rabbit Pyrogen Tests
- Limulus Amebocyte Lysate Tests
- Others
- Market Size (US$ Mn) Analysis and Forecast, By End User, 2025 - 2032
- Pharmaceutical Companies
- Biotechnology Companies
- Medical Device Companies
- Diagnostic Laboratories
- Others
- Market Attractiveness Analysis
- South Asia & Oceania Pyrogen Testing Market Outlook:
- Key Highlights
- Historical Market Size (US$ Mn) Analysis, By Market, 2019 - 2024
- By Country
- By Product & Service
- By Test
- By End User
- Market Size (US$ Mn) Analysis and Forecast, By Country, 2025 - 2032
- India
- Southeast Asia
- ANZ
- Rest of South Asia & Oceania
- Market Size (US$ Mn) Analysis and Forecast, By Product & Service, 2025 - 2032
- Instruments
- Consumables
- Services
- Market Size (US$ Mn) Analysis and Forecast, By Test, 2025 - 2032
- In-vitro-based Pyrogen Tests
- Rabbit Pyrogen Tests
- Limulus Amebocyte Lysate Tests
- Others
- Market Size (US$ Mn) Analysis and Forecast, By End User, 2025 - 2032
- Pharmaceutical Companies
- Biotechnology Companies
- Medical Device Companies
- Diagnostic Laboratories
- Others
- Market Attractiveness Analysis
- Latin America Pyrogen Testing Market Outlook:
- Key Highlights
- Historical Market Size (US$ Mn) Analysis, By Market, 2019 - 2024
- By Country
- By Product & Service
- By Test
- By End User
- Market Size (US$ Mn) Analysis and Forecast, By Country, 2025 - 2032
- Brazil
- Mexico
- Rest of Latin America
- Market Size (US$ Mn) Analysis and Forecast, By Product & Service, 2025 - 2032
- Instruments
- Consumables
- Services
- Market Size (US$ Mn) Analysis and Forecast, By Test, 2025 - 2032
- In-vitro-based Pyrogen Tests
- Rabbit Pyrogen Tests
- Limulus Amebocyte Lysate Tests
- Others
- Market Size (US$ Mn) Analysis and Forecast, By End User, 2025 - 2032
- Pharmaceutical Companies
- Biotechnology Companies
- Medical Device Companies
- Diagnostic Laboratories
- Others
- Market Attractiveness Analysis
- Middle East & Africa Pyrogen Testing Market Outlook:
- Key Highlights
- Historical Market Size (US$ Mn) Analysis, By Market, 2019 - 2024
- By Country
- By Product & Service
- By Test
- By End User
- Market Size (US$ Mn) Analysis and Forecast, By Country, 2025 - 2032
- GCC Countries
- Egypt
- South Africa
- Northern Africa
- Rest of Middle East & Africa
- Market Size (US$ Mn) Analysis and Forecast, By Product & Service, 2025 - 2032
- Instruments
- Consumables
- Services
- Market Size (US$ Mn) Analysis and Forecast, By Test, 2025 - 2032
- In-vitro-based Pyrogen Tests
- Rabbit Pyrogen Tests
- Limulus Amebocyte Lysate Tests
- Others
- Market Size (US$ Mn) Analysis and Forecast, By End User, 2025 - 2032
- Pharmaceutical Companies
- Biotechnology Companies
- Medical Device Companies
- Diagnostic Laboratories
- Others
- Market Attractiveness Analysis
- Competition Landscape
- Market Share Analysis, 2024
- Market Structure
- Competition Intensity Mapping By Market
- Competition Dashboard
- Company Profiles (Details - Overview, Financials, Strategy, Recent Developments)
- Charles River Laboratories, Inc
- Overview
- Segments and Product & Services
- Key Financials
- Market Developments
- Market Strategy
- Lonza
- Merck KGaA
- Thermo Fisher Scientific, Inc.
- Associates of Cape Cod, Inc.
- GenScript Biotech Corporation
- bioMérieux SA.
- FUJIFILM Wako Pure Chemical Corporation
- Eurofins Scientific
- WuXi AppTec
- Hycult Biotech
- Cormica Ltd
- Nelson Laboratories, LLC - A Sotera Health company
- Charles River Laboratories, Inc
- Appendix
- Research Methodology
- Research Assumptions
- Acronyms and Abbreviations

Loading page data
Please wait a moment


